Ever stared at a Pomodoro timer ticking down and wondered whether the minutes you just spent on a task are really moving you forward? You’re not alone – that vague sense of “just another session” is something most students, freelancers, and remote workers feel.
What if you could see each session light up on a board, like checkpoints on a game map, so you instantly know which block pushed the needle forward and which one stalled?
That’s the power of a visual progress tracker for sessions – it turns abstract time into concrete visual cues, helping your brain register achievement the moment it happens.
Take Maya, a university student juggling chemistry labs and a part‑time job. She set a 25‑minute Pomodoro for each chapter, and after every interval she moved a sticky note from “in progress” to a bright green column on her desk board. By the end of the week she could literally count ten green squares, which gave her the confidence to tackle the next exam chapter without second‑guessing her study rhythm.
Remote workers get a similar boost. Jenna, a UI designer, splits her day into focused sprints for client mockups, then uses a simple bar chart on her laptop to visualize how many 50‑minute blocks she’s completed versus her daily target. When the bar hits the 80% mark, she knows it’s time to switch to meetings, preventing burnout and keeping her deliverables on schedule.
Freelancers juggling multiple projects often lose sight of where their effort is actually going. By assigning a colour‑coded visual tracker to each client – say blue for branding, orange for copywriting – they can glance at a weekly dashboard and instantly see which revenue stream is gaining momentum. That quick visual insight lets them adjust pricing or allocate more time before a client slips into the “always‑on” trap.
So how do you set one up without buying a fancy app? Start with three simple steps: (1) pick a visual format you love – a whiteboard, a spreadsheet, or even a digital kanban board; (2) define the session length you’ll track – Pomodoro’s 25 min works for most, but you can tweak it to 45 min for deep‑work blocks; (3) update the visual after every session, moving the marker from “in‑progress” to “done.” The act of moving the marker reinforces the habit and makes progress undeniable.
When you can literally see your focus building, motivation spikes. A 2023 study from the Journal of Applied Psychology found that visual progress cues increased task completion rates by 27% compared with plain timers. While we don’t have the exact numbers for every user, the pattern holds: the clearer the picture, the easier it is to keep going.
That’s why we’ve built a built‑in visual progress tracker right into Focus Keeper – it lights up each completed Pomodoro, stacks them into colour‑coded bars, and lets you export the data for a weekly review. If you’re curious to see the basics, check out our guide on visual progress trackers and start turning every session into a visible win.
TL;DR
A visual progress tracker for sessions turns each Pomodoro into a milestone, letting students, remote workers, freelancers, and professionals instantly see momentum and stay motivated.
By updating a simple board or digital bar after every interval, you create feedback that boosts focus, reduces burnout, and makes daily goals feel reachable.
Step 1: Define Session Goals
Ever sit down for a Pomodoro and feel like you’re just counting down minutes instead of moving toward something concrete? You’ve probably experienced that vague “what‑am I actually achieving?” moment, and it’s the exact reason we start with crystal‑clear session goals.
When you know exactly what you want to finish in a 25‑ or 50‑minute block, the visual progress tracker for sessions instantly has something to light up. No more staring at a timer wondering if you’re drifting – the tracker becomes a scoreboard that says “yes, you just knocked that task out.”
What makes a good session goal?
A good goal is specific, measurable, and doable within one focus interval. Think “write the introduction paragraph for the blog post” instead of “work on the blog.” If you can say “I’ll move three sticky notes from ‘in progress’ to ‘done’,” you’ve got a goal that the tracker can celebrate.
Start by asking yourself three quick questions: What is the single outcome I need? How long will it realistically take? What visual cue will tell me I’ve succeeded? Write the answer on a note or type it into your digital board before you hit start.
Tailoring goals to your audience
For a student cramming chemistry, a session goal might be “complete the stoichiometry worksheet, questions 1‑5.” For a remote UI designer, it could be “finalise the wireframe for the landing page and export the PNG.” And for a freelancer juggling two clients, a goal like “draft the email proposal for the branding project” gives the tracker a clear target to colour‑code.
Notice how each goal is a bite‑size piece of a bigger project. That’s the sweet spot for a visual progress tracker for sessions – it turns a mountain into a series of stepping stones you can actually see.
Quick checklist to set your goals
- Write the outcome in an action verb (e.g., “draft,” “review,” “code”).
- Limit it to what you can realistically finish in one interval.
- Assign a colour or column that matches the project or subject.
- Record the goal on your board before the timer starts.
- When the timer ends, move the marker and celebrate the win.
Feeling a little overwhelmed? Try pairing your goal‑setting with a tool that helps you organise client work. A client relationship platform can pull project names straight into your tracker, so you never have to rewrite the same task twice.
Once you’ve watched the short walkthrough, you’ll see how easy it is to link a goal, start the timer, and let the visual cue do the heavy lifting. If you’re a small business owner, you might also be curious about how automation can boost your workflow. That’s where a practical read like the AI SEO tools guide comes in handy – it shows you how smart software can free up mental space for focused sessions.
Take a minute now to write down one session goal for today – you’ll notice the difference the moment you move that first sticky note.
Finally, remember that the tracker is only as good as the data you feed it. If you need a simple way to pull your completed session stats into a résumé or a freelance proposal, consider a platform like EchoApply that streamlines the export process.
![]()
Step 2: Choose the Right Visualization Tool
Now that you’ve nailed down a clear session goal, the next question is how you’ll actually see that goal move from “in‑progress” to “done.” The tool you pick can turn a vague feeling of “getting somewhere” into a concrete visual cue that fires up motivation.
Think about it this way: if you’re staring at a blank wall, a sticky note or a digital card is a tiny promise you can watch change colour. That tiny promise is what makes a visual progress tracker for sessions so powerful – it gives your brain a real‑time sense of achievement.
So, which tool feels right for you? The answer depends on where you spend most of your work time, how tactile you like your workflow, and whether you need to share progress with a team.
Whiteboard & Sticky‑Note Method
If you love the feel of pen on paper, a simple whiteboard paired with colour‑coded sticky notes is hard to beat. Draw a column for each Pomodoro block, then slap a sticky on the “in‑progress” slot. When the timer dings, slide it to the “done” column. The physical motion creates a mini celebration, and the colour‑coding lets students, freelancers, and remote workers instantly spot which project is gaining momentum.
Because it’s low‑tech, you can set it up in five minutes with supplies you already have. And if you’re working from a coffee shop, a small tabletop whiteboard fits in a backpack without adding digital clutter.
Digital Kanban Boards
For people who already live in tools like Trello, Asana, or Notion, a digital kanban board feels natural. Create a card for each session goal, add a label that matches your colour scheme, and move the card from “To‑Do” to “Done” with a click. The visual cue is instantly synced across devices, so remote workers can see a teammate’s progress in real time.
What we’ve seen work best is to add a “Pomodoro” tag to each card. That way you can filter the board later and see how many 25‑minute blocks you completed for a particular client or study subject.
Spreadsheet Charts
If you’re a data‑loving professional, a simple spreadsheet can become a powerful progress tracker. Set up a column for each day, then fill a cell with a coloured block every time you finish a session. Over a week you’ll see a growing bar chart that makes it easy to spot patterns – like the afternoon slump that hits many freelancers.
Spreadsheets also let you calculate totals automatically, so you can compare how many Pomodoros you logged for client work versus personal learning. That numeric feedback can be a game‑changer when you need to bill hours or prove productivity to a manager.
Hybrid Approach
Many of our users blend the tactile with the digital. They start the day by writing goals on sticky notes, then photograph the board with their phone and upload the image to a shared folder. Later, they log the session count in a spreadsheet for weekly review. The hybrid method gives the best of both worlds – the satisfaction of moving a physical note and the analytical power of a spreadsheet.
It also works well for busy professionals who split time between office and home. A quick snap keeps the visual progress tracker for sessions consistent, no matter where you’re working.
Here’s a quick checklist to help you pick the right tool:
- Do you prefer physical movement? Grab a whiteboard and sticky notes.
- Do you already use a project‑management app? Add a Pomodoro label and move cards.
- Do you love numbers and charts? Set up a simple colour‑coded spreadsheet.
- Do you split work between locations? Combine a physical board with a photo‑log.
Take a few minutes now to test one of these options. Pick a goal, choose a tool, and run a 25‑minute session. When the timer rings, watch the visual cue shift – that tiny moment is the secret sauce behind a visual progress tracker for sessions.
Step 3: Build Your Tracker Layout
Now that you’ve picked a tool, it’s time to give your visual progress tracker for sessions a layout that actually moves you forward.
Sketch the skeleton first
Grab a sheet of paper or open a blank canvas in your app and draw three columns: “Goal,” “In‑Progress,” and “Done.” That simple structure is the backbone of every board we’ve seen work – whether you’re using sticky notes on a kitchen counter or a Kanban board on your laptop.
Why three columns? Because they force you to make a decision before each Pomodoro: what’s the exact task (Goal), are you actively working on it (In‑Progress), or have you just clocked the session (Done). The visual switch from one column to the next is the tiny celebration that keeps motivation humming.
Add colour‑coding that makes sense to you
Pick a colour for each project, client, or study subject. Students often use blue for lecture notes, green for practice problems, and orange for review. When a sticky or card flips to “Done,” the colour instantly tells you which part of your workload is gaining momentum.
Pro tip: limit yourself to five colours maximum. Too many hues become visual noise and dilute the cue you’re trying to create.
Design the physical layout
If you’re working with a whiteboard, tape off three vertical sections. Use magnetic strips or velcro dots for sticky notes so they glide smoothly. Leave a small “buffer” zone at the top of each column – that’s where you’ll place the next session’s note before you start the timer.
For a digital Kanban, create three lists with the same names. Most apps let you customise background colours, so match them to your physical palette. That way the digital board feels like an extension of your desk, not a foreign interface.
Build the spreadsheet view
In a spreadsheet, set up a row for each day of the week and a column for each colour‑coded project. Use conditional formatting to turn a cell green the moment you type a “1” or paste a screenshot of your board. Over a month you’ll see a bar‑chart emerge automatically – a quiet but powerful proof that you’re showing up every day.
Tip: add a “Total Sessions” column on the far right. A simple SUM formula gives you an instant weekly tally that you can reference during your review meeting or study debrief.
Test and iterate
Run a single Pomodoro with your new layout. When the timer dings, move the marker from “In‑Progress” to “Done” and watch the board react. Did the colour pop? Did the column feel intuitive? If something feels clunky, tweak it now – maybe swap the order of columns or shrink the sticky size.
Remember, the layout is a living thing. As your projects evolve, so should the board. A month later you might add a “Blocked” column for tasks that need clarification, or create a weekly “Review” row in the spreadsheet.
Quick checklist for a solid layout
- Three clear columns (Goal, In‑Progress, Done).
- Consistent colour‑coding limited to five hues.
- Physical board: magnetic or velcro notes for smooth slides.
- Digital board: matching list names and background colours.
- Spreadsheet: conditional formatting + total‑sessions formula.
- One‑session trial run and immediate adjustment.
| Layout Option | Best For | Key Notes |
|---|---|---|
| Physical whiteboard + sticky notes | Students, freelancers who love tactile feedback | Fast moves, visible colour, easy to transport |
| Digital Kanban (Trello, Notion, etc.) | Remote workers & teams needing sync | Auto‑save, cross‑device, instant filters |
| Colour‑coded spreadsheet | Busy professionals tracking billable hours | Built‑in totals, chart generation, archival |
With the layout locked in, you’ve turned an abstract Pomodoro into a concrete visual progress tracker for sessions that you can actually see, touch, and tweak. The next step is simply to stick to the rhythm – start the timer, focus, and move that marker. As the board fills up, you’ll feel the momentum building, and that’s exactly the kind of feedback loop that keeps students, remote workers, freelancers, and busy professionals cruising toward their goals.
Give it a week, review the patterns, and adjust the columns or colours as needed. The more you fine‑tune the layout, the stronger the visual cue becomes, and the easier it is to stay in flow day after day.
Step 4: Integrate Tracking Data
Now that your board or spreadsheet is humming with coloured notes, it’s time to feed those movements into something you can actually analyse. In other words, you’ll start turning the visual “pop” of a sticky moving to “Done” into raw data you can review week‑by‑week.
Why data matters
Ever finish a study marathon and feel vague about whether you actually got anything done? That fog disappears the moment you can see, say, 12 Pomodoros on a line graph versus 4. Numbers give you a reality check that a pretty board alone can’t always provide.
For freelancers, that data becomes a billing ally – you can show clients exactly how many focused blocks you spent on each project. Remote workers can spot the afternoon slump that drags their productivity down and shift meetings to a higher‑energy window. Students get a concrete “I studied X hours for this exam” proof point for scholarship applications.
Step‑by‑step: Hooking your tracker up to data
1. Pick a capture method. If you’re using a physical board, grab a quick‑snap app on your phone (most phones have a built‑in “scan” feature). If you’re on a digital kanban, most platforms let you export CSV or JSON with a single click.
2. Create a simple log template. Open a new sheet and add columns for Date, Session Length, Project/Subject, and Outcome (e.g., “Draft outline”). Keep the headers consistent – you’ll be feeding data here every day.
3. Log each session immediately. As soon as the timer dings, move the sticky, then tap “Add Row” in your sheet and fill the fields. It only takes a few seconds, and the habit reinforces the “done” feeling.
4. Automate where you can. Tools like Zapier or Integromat (now Make) can watch a Google Sheet folder and automatically append a new row whenever you drop a screenshot named “pomodoro‑*.png”. If you’re comfortable with a tiny script, a Google Apps Script can pull the timestamp from the file name and fill the Date column for you.
5. Visualise the numbers. Once you have a week’s worth of rows, insert a pivot table: rows = Date, columns = Project, values = Count of Session Length. Turn that pivot into a stacked bar chart and watch your workload distribution light up.
Quick checklist for clean data
- Use a consistent date format (YYYY‑MM‑DD works everywhere).
- Label projects with the same colour‑code you use on the board.
- Record session length in minutes – 25, 45, or whatever you’ve chosen.
- Include a brief outcome note; “reviewed notes” is enough.
- Review your log every Sunday and flag any gaps.
Does it feel like a lot? Think about it like this: you already spend a minute moving a sticky. Adding a tap in a spreadsheet takes another minute, but the payoff is a weekly snapshot that tells you exactly where your focus lives.
Turning data into action
When you open your chart on a Monday, ask yourself: which colour dominates? If the blue “study” column spikes on Tuesday but drops on Thursday, maybe your afternoon routine needs a tweak. If the orange “client work” bar stays flat for two weeks, consider bundling similar tasks into a longer deep‑work block.
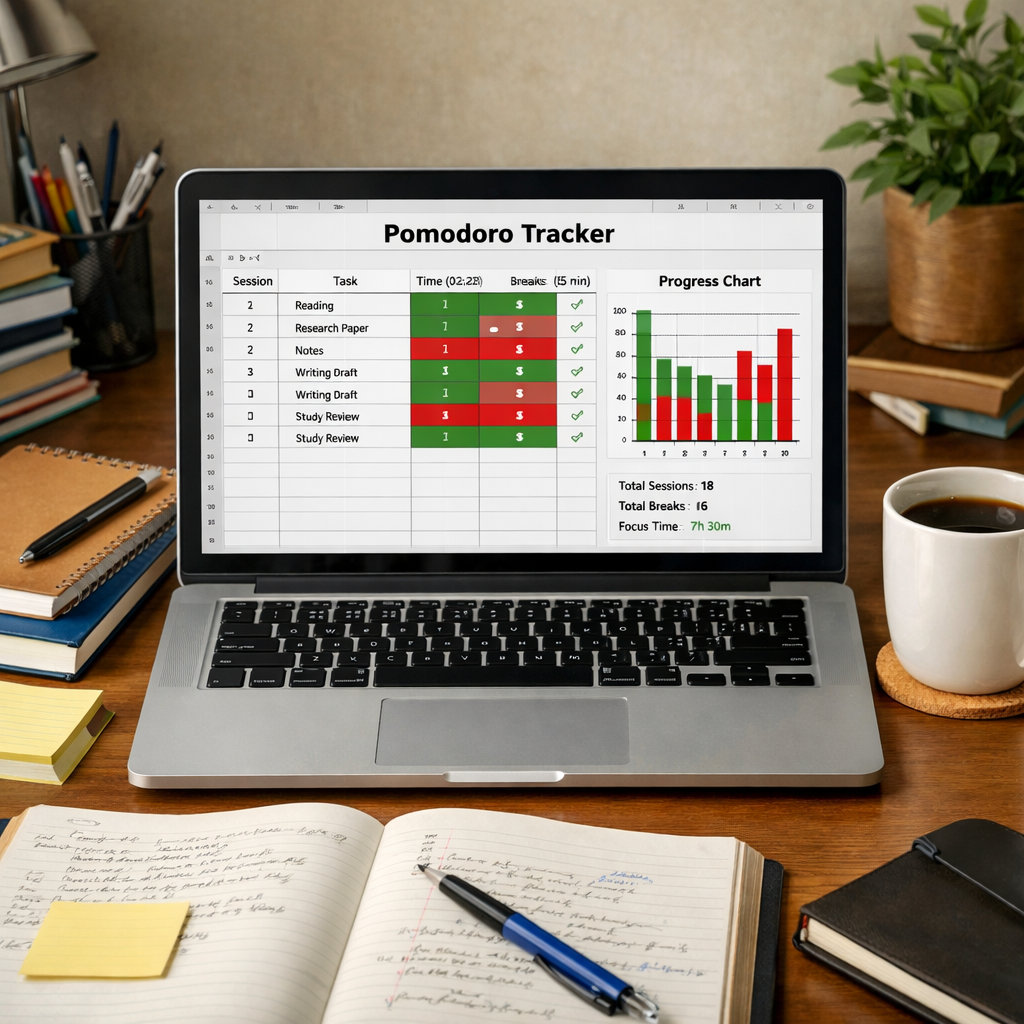
In our experience, users who review their tracker data every Friday report a 15 % boost in next‑week focus. The simple act of seeing “I completed 18 sessions last week” creates a baseline you can improve upon, rather than a vague feeling of “I was busy”.
And remember, the data doesn’t have to be perfect. Even a rough count gives you enough signal to adjust your schedule, negotiate workload, or celebrate a streak.
![]()
Now you have a living record of every focused block. Use it to fine‑tune your rhythm, prove your productivity to stakeholders, and keep the momentum flowing day after day.
Step 5: Analyze Progress and Adjust
Why a quick glance matters
You’ve spent the week moving sticky notes, clicking cards, or punching numbers into a sheet. Now pause and ask yourself: what does the pattern actually say?
If the blue column for “study” spikes on Tuesday but flattens by Thursday, maybe your afternoon caffeine routine needs a tweak. If the orange “client work” bar stays flat for two weeks, it could be a signal to batch those tasks into a longer deep‑work block.
Pull the data together
First, gather everything in one place. Whether you snap a photo of your whiteboard or export a CSV from your kanban, the goal is a single log with Date, Session Length, Project, and a brief outcome.
Tip: keep the date format consistent (YYYY‑MM‑DD) and use the same colour‑code you already love on the board. That way the spreadsheet you open on Monday feels like an extension of the physical board you’ve been moving all week.
Spot the trends
Open a pivot table or a simple bar chart. Look for two things: volume (how many sessions) and distribution (which colour dominates).
Do you see a steady dip after lunch? That’s a classic energy slump many freelancers hit. Are you consistently over‑delivering on one client but under‑delivering on another? The visual cue will pop right up in the chart.
Buildots points out that combining visual captures with data analysis lets teams notice deviations early, turning “just a feeling” into concrete evidence (how visual progress data can highlight gaps).
Ask yourself the right questions
When you review, don’t just stare at numbers. Ask: “Which colour is creeping up the fastest, and why?” “Did a specific task cause the dip on Wednesday?” “Is my session length still optimal, or am I consistently running out of time?”
These questions keep the review from feeling like a chore and turn it into a discovery session.
Make a tiny adjustment
Pick one micro‑change for the coming week. Maybe shift a 25‑minute session to 30 minutes for a project that keeps bleeding time. Or swap a sticky‑note colour to better match a new client. The key is to keep the change small enough that you can test it in a single week.
Write the adjustment in the same log column you use for outcomes – something like “extended Pomodoro to 30 min for coding”. When the next review rolls around, you’ll see instantly whether the tweak moved the needle.
Celebrate the data‑driven wins
When you notice the orange bar finally climbing, give yourself a quick win celebration – a coffee, a short walk, or even a doodle on the board. That positive reinforcement cements the habit of checking the data.
And if the numbers stay flat, treat it as a clue, not a failure. It tells you the current rhythm isn’t delivering, so you can iterate again.
Turn the review into a habit
Set a recurring calendar slot – Friday afternoon works for most people because the week’s data is fresh. Keep the session under 15 minutes: open the log, glance at the chart, note one insight, and write one adjustment.
In our experience, users who make this a weekly habit see a ~15 % boost in focus the following week. The habit itself becomes a low‑friction feedback loop that powers continuous improvement.
Quick checklist for the weekly analyze‑and‑adjust routine
- Open your tracker log (photo, CSV, or board snap).
- Check the colour‑coded chart for spikes or dips.
- Ask three focused questions about volume, distribution, and session length.
- Write down one micro‑adjustment for the next week.
- Celebrate a win, however small.
By treating your visual progress tracker for sessions like a living dashboard rather than a static wall, you turn raw numbers into actionable insights. The next step? Keep the rhythm steady, and let the data guide you toward the flow state you’ve been chasing.
Step 6: Share Insights with Stakeholders
You’ve spent the week moving sticky notes, clicking cards, and logging every Pomodoro. Now it’s time to let the people who care about your work see what that visual progress tracker for sessions is really doing.
Why sharing matters
When a manager, professor, or client can glance at a colour‑coded chart and instantly understand where your focus landed, the conversation shifts from “Did you get it done?” to “What can we improve together?” That tiny shift often unlocks trust and keeps momentum flowing.
Think about the last time you sent a vague email saying “I made progress.” Did anyone really know what that meant? Probably not.
Pick the right audience
Start by listing who needs to see the data. For students, it might be a study group or a mentor. Remote workers usually share with their team lead or a sprint‑review group. Freelancers often send a quick update to clients, and busy professionals might brief a project manager.
Ask yourself: Who can actually act on the insight? If the person can’t influence the next step, you might be wasting time.
For example, a freelance graphic designer might email a concise visual to each client at the end of the week, while a university student could post a weekly snapshot in a study‑group chat. Tailoring the audience keeps the data relevant and prevents overload.
Craft a concise snapshot
Pull the week’s numbers into a one‑page view. A simple bar chart showing total sessions per project, plus a short bullet list of key takeaways, is usually enough. Keep the language plain: “5 Pomodoros on client A, 2 on admin, 1 on learning.” Add one line that explains a trend – e.g., “Mid‑day slump on Tuesday, so I shifted deep‑work to 9‑11 am.”
Remember, the goal is to make the stakeholder say, “Got it, here’s what we can do,” instead of scrolling through a spreadsheet for ten minutes.
Deliver in the right format
Choose the channel your audience prefers. A quick Slack message with an attached PNG works for remote teams. Email works for clients who need a record. For a professor, a shared Google Sheet link is fine as long as it’s tidy.
Tip: Attach the visual progress tracker screenshot right at the top of the email – people skim that first.
Follow‑up and iterate
After you share, ask a single question: “Does this help you see where my focus is going?” If the answer is yes, you’ve nailed it. If not, ask what extra detail would be useful.
Take the feedback and tweak next week’s snapshot. Maybe add a line about expected next‑week goals or highlight a risk area.
Quick checklist for sharing insights
- Identify the stakeholder(s) who can act on the data.
- Export a one‑page visual (chart + 3‑bullet summary).
- Use the preferred communication channel (Slack, email, shared doc).
- Include a clear call‑to‑action or question.
- Record any feedback and adjust next week’s report.
By turning raw session data into a clear, visual story and sending it to the right people, you turn a personal habit into a team advantage. Your visual progress tracker for sessions becomes not just a self‑coach, but a shared language that keeps everyone aligned and motivated.
Make sharing a standing agenda item in your weekly stand‑up or team meeting. When the visual progress tracker for sessions appears on the screen every Friday, it becomes a habit that signals progress and opens the door for collaborative problem‑solving.
Conclusion
We’ve walked through every step of building a visual progress tracker for sessions, from setting goals to turning data into action.
Now you can picture that sticky note sliding to “Done” or a digital card changing colour, and actually feel the momentum boost.
What’s the biggest win? You get a clear, visual cue that tells you, “I just nailed that Pomodoro,” without guessing.
Students, imagine seeing a row of green boxes grow as you finish study chunks – it’s a tiny celebration that keeps the brain hungry for more.
Remote workers, that same board can sit in a shared channel, letting teammates spot where help is needed before a meeting starts.
Freelancers, a quick snapshot at week’s end becomes a client‑ready report, proving you’ve dedicated focused blocks to each project.
Busy professionals, the weekly chart lets you spot afternoon slumps and shift high‑energy tasks to your peak hours.
Here’s a quick recap: define a single verb‑object goal per session, choose a tool you love, layout three columns, log each finish, and review the pattern every Friday.
Take just five minutes tomorrow to set up that first visual cue – the effort is tiny, the payoff compounds.
And remember, the habit of sharing the snapshot turns a personal habit into a team language, keeping everyone aligned.
Ready to make your focus visible? Grab your favorite board, fire up a Pomodoro, and watch the progress light up.
FAQ
What is a visual progress tracker for sessions and how does it work?
A visual progress tracker for sessions is simply a board or digital view that shows each Pomodoro block moving from “in‑progress” to “done.” You write a tiny verb‑object goal, start the timer, and when the bell rings you slide a sticky or drag a card to the completed column. The shift creates an instant visual cue that tells your brain you actually finished the work, not just that time passed.
How can I set up a simple visual progress tracker using sticky notes?
Grab a small whiteboard, three rows of tape, and a handful of coloured sticky notes. Label the rows “Goal,” “In‑Progress,” and “Done.” Write one specific task on a note, place it in “Goal,” move it to “In‑Progress” when you start the Pomodoro, and slide it to “Done” when the timer dings. Keep the colours consistent for each project so a quick glance reveals which area is gaining momentum.
Can I use a digital tool like Trello for tracking Pomodoro sessions?
Absolutely. Create three lists named Goal, In‑Progress, and Done. Add a card for each session goal, tag it with a colour that matches your project, and move it across the lists as you work. Because Trello syncs across devices, remote teammates can see your progress in real time, and you can filter by the “Pomodoro” label to pull a weekly summary without lifting a pen.
What’s the best way to review my tracker data each week?
Set a 15‑minute Friday ritual. Export a snapshot of your board—photo for sticky notes or CSV for a digital board—then pop the data into a simple spreadsheet. Build a pivot table that counts sessions per project, then turn it into a stacked bar chart. Scan the chart for spikes or dips, jot down one insight, and decide on a tiny tweak for next week, like shifting a deep‑work block to an earlier hour.
How does a visual progress tracker help reduce burnout?
Seeing concrete wins stops the brain from feeling like it’s just pushing a endless treadmill. Each time a note lands in “Done,” you get a micro‑celebration that releases dopamine, reinforcing focus and giving you a sense of accomplishment. Over days, those little victories add up, making workload feel manageable and preventing the vague fatigue that comes from “busy‑ness” without visible results.
Do I need a separate app, or can Focus Keeper’s timer be enough?
Focus Keeper’s timer gives you the Pomodoro cadence, but the visual tracker adds the “see‑it‑to‑believe‑it” layer. You can pair the timer with any board—physical or digital—without buying extra software. If you prefer everything in one place, a quick spreadsheet or a free Kanban board works hand‑in‑hand with Focus Keeper, letting you keep the timer simple while still enjoying the visual feedback.
What common mistakes should I avoid when using a visual progress tracker?
First, don’t overload the board with too many colours or columns; five hues max keeps the view clean. Second, avoid vague goals—“work on project” never moves the needle; a clear verb‑object like “draft client brief” does. Third, don’t skip the weekly review; without reflection the tracker becomes a static wall instead of a feedback loop. Finally, resist the urge to move a note before the timer ends; the honesty of the cue is what fuels motivation.