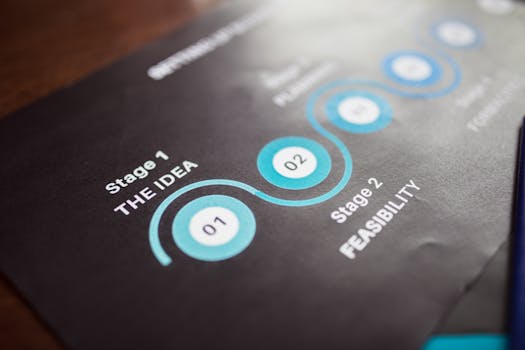
What is project timeline visualization?

What is project timeline visualization?
Project timeline visualization is an essential tool in the realm of project management that allows teams to map out their tasks, deadlines, and overall progress in a visual format. By creating a clear visual representation of a project’s timeline, stakeholders can easily comprehend the flow from one phase to the next, making it simpler to identify potential bottlenecks and ensure timely completion.
Think about it: if you’ve ever felt overwhelmed by lengthy project plans or complex spreadsheets, you know the significance of seeing your project at a glance. Let’s explore what project timeline visualization is, how it works, and why it’s crucial for effective project management.
Understanding Project Timeline Visualization
Definition and Purpose
In simple terms, project timeline visualization is the practice of creating graphical representations of a project’s timeline. This could be through charts, graphs, or other visual tools that help depict the start and end dates of various tasks, their durations, and relationships to one another. The primary purpose of timeline visualization is to enhance understanding and communication surrounding project progress and requirements.
The beauty of project timeline visualization lies in its ability to break down complex project structures and provide clarity. It allows project managers and teams to see not just the tasks at hand but also how they interconnect, which can significantly influence project delivery.
Types of Project Timeline Visualizations
There are several types of project timeline visualizations, each serving distinct purposes:
-
Gantt Charts: These are perhaps the most recognized type of project timeline. Gantt charts display tasks along a timeline, showcasing their duration and overlapping timelines, making it easy to see which tasks are on track or behind schedule.
-
Timelines: A straightforward linear representation, timelines focus on key milestones and deadlines within a project. They allow stakeholders to grasp major events without delving into intricate task details.
-
Kanban Boards: While not traditional timelines, Kanban boards visually represent work in progress and stages, helping teams manage tasks and visualize workflow.
-
Roadmaps: These high-level visualizations outline the strategic direction of a project, often displaying major deliverables and timelines over a longer duration.
By employing various types of visualizations, project managers can tailor their approach depending on the project’s complexity and the audience’s needs. For more insights on visual project management tools, you can check out Asana’s resource on visual project management.
Benefits of Project Timeline Visualization
Improved Clarity and Organization
One of the standout benefits of project timeline visualization is the improved clarity it brings to project goals and tasks. With a visual structure, it’s easier to understand what needs to be done and when. This clarity can significantly reduce miscommunication among team members and ensure everyone is on the same page.
Enhanced Collaboration and Communication
Visual timelines foster better collaboration. When team members can see the timeline, they can discuss progress, address concerns, and adjust tasks in real-time. This not only enhances communication but also builds a stronger team dynamic, as everyone is aware of their roles and responsibilities.
Tracking Progress and Milestones
Another critical advantage is the ability to track progress effectively. Visual timelines make it simpler to identify key milestones and deadlines. For instance, if a team is falling behind schedule, project managers can quickly assess which tasks are causing delays and reallocate resources accordingly. This proactive approach can help avoid major setbacks.
To understand the benefits more deeply, you might want to explore Freshbooks’ article on project timelines.
How to Create Effective Project Timeline Visualizations
Choosing the Right Tools
Creating effective project timeline visualizations begins with selecting the right tools. There are numerous software options available that cater to different needs. Popular choices include Trello for Kanban boards, Lucidchart for timeline creation, and Monday.com for comprehensive project management. Choosing a tool that fits your team’s workflow can significantly enhance your visualization efforts.
Setting Up the Timeline
Once the right tools are in place, it’s time to set up the timeline. Begin by defining tasks, deadlines, and resources. List out all project components and their respective time frames. This process can be as simple as drawing a line and marking important dates or as complex as filling in a detailed Gantt chart. The key is to ensure that everything is accurately represented.
Customization and Updates
Customizing your project timeline is crucial. Different projects have different needs, so add elements that matter for your specific context. Regular updates are equally important. As project dynamics change, so should your timeline. Keeping it updated ensures that all stakeholders are aware of the latest developments and adjustments.
Best Practices for Project Timeline Visualization
Regular Reviews and Adjustments
To maximize effectiveness, it’s vital to conduct regular reviews of the project timeline. This could be weekly or bi-weekly, depending on the project’s pace. During these reviews, assess what’s working and what isn’t. Adjustments should be made based on real-time project insights to keep everything on track.
Utilizing Feedback for Improvements
Encouraging team feedback can lead to significant improvements in your project timeline visualizations. Team members can provide valuable insights on usability and clarity. If something isn’t working for them, it’s likely others feel the same way. By refining the visualizations based on feedback, you can enhance overall project efficiency.
For additional examples and best practices, consider exploring examples of project timelines.
Conclusion
Project timeline visualization is a game-changer in the world of project management. By providing clear, visual representations of tasks and timelines, it enhances clarity, fosters collaboration, and aids in tracking progress. As you incorporate these visual tools into your workflow, you’ll find that not only does project management become simpler, but it also leads to increased productivity and success. Embrace project timeline visualization to ensure your projects are completed efficiently and effectively.