Ever opened a study timer, hit start, and then wondered exactly how those minutes added up?
You’re not alone. Many of us—students cramming for finals, remote workers juggling Zoom calls, freelancers hopping between client projects—feel a weird gap between the clock on the wall and the real flow of our work. That’s where session analytics steps in, turning those blurry intervals into clear, actionable insights.
Think of session analytics as a friendly detective that watches how long you stay focused, where you take breaks, and which tasks stretch out longer than expected. Instead of guessing why your concentration drops after the third Pomodoro, you get concrete numbers that point to patterns you can tweak.
In our experience at Focus Keeper, we’ve seen people stare at a simple timer and miss the bigger story—like how a 25‑minute burst followed by a five‑minute pause can actually boost retention for a student, or how a remote developer might need a longer 50‑minute stretch to finish a code review. Session analytics surfaces those nuances without demanding a data‑science degree.
So, what does that look like day‑to‑day? Imagine you start a study session at 9 am. Your analytics dashboard logs a 25‑minute focus span, a five‑minute break, then another 25‑minute minutes, and finally a 10‑minute pause because you got distracted by an email. After a week, you notice the 10‑minute pauses always happen after a specific subject. Armed with that insight, you can rearrange your schedule, perhaps tackling that tricky subject first when your energy is highest.
Does it feel a bit like spying on yourself? Maybe. But the goal isn’t surveillance—it’s empowerment. By visualizing session duration, frequency, and drop‑off points, you can experiment: extend a Pomodoro, shorten breaks, or batch similar tasks together. The data tells you what works and what doesn’t, so you spend less time guessing and more time actually getting things done.
Ready to turn those vague feelings of “I’m busy” into solid numbers you can act on? Let’s dive deeper into how session analytics can reshape your productivity rhythm.
TL;DR
Session analytics quickly turns vague work minutes into clear, actionable data, showing you exactly when focus spikes, when breaks help, and which tasks need reshuffling.
By spotting these patterns, students, remote workers, freelancers, and busy professionals can fine‑tune Pomodoro cycles, boost retention, and reclaim productivity without guessing, all in real‑time.
Understanding Session Analytics
Ever felt like you’re sprinting through a Pomodoro only to wonder where the energy vanished? That vague feeling is exactly what session analytics shines a light on. It takes the raw stream of start‑stop timestamps and turns them into a story you can actually read.
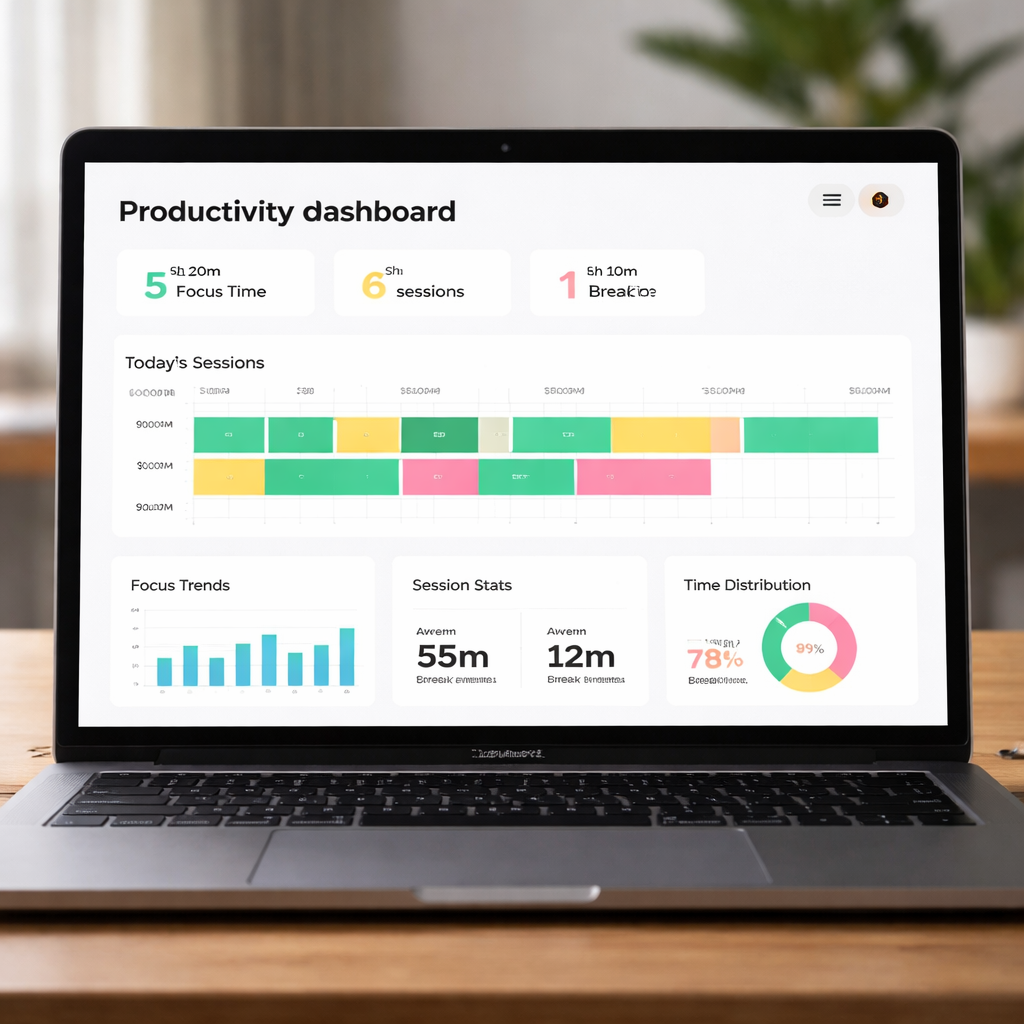
First, let’s break down what the data actually tells you. A typical dashboard will show three core metrics: total focus time, average session length, and break frequency. When you look at those numbers side‑by‑side, patterns pop up faster than a coffee‑fueled brain‑storm.
For a student cramming for finals, you might see that 25‑minute bursts are solid until the third cycle, where focus drops by 30%. A remote worker could discover that a 50‑minute block followed by a 10‑minute walk keeps code‑review fatigue at bay. Those insights are the engine behind tweaking your schedule.
So, how do you actually read the charts? Start with the “heat map” view – it colours each session by intensity. Darker shades mean higher concentration, lighter shades indicate drift. If you notice a consistent light patch after lunch, that’s a cue to either shift demanding tasks to the morning or experiment with a longer break.
And here’s a quick sanity check: does your break length line up with the classic 5‑minute rule? If the data shows you’re taking 12‑minute pauses, you might be unintentionally extending downtime and breaking momentum.
Practical ways to act on the numbers
1️⃣ Identify the sweet‑spot session length. Pull the average session duration column and see where the drop‑off curve steepens. Adjust your Pomodoro timer to match that sweet spot – it could be 30 minutes for a freelance writer, 45 for a software dev.
2️⃣ Match task type to energy level. Heavy‑cognitive work (like math problems) should land in your highest‑intensity window, while admin chores can slide into the lower‑intensity slots.
3️⃣ Iterate weekly. Export the CSV, glance at the trend line, and make one tiny tweak. Over a month you’ll see a measurable lift in total productive minutes.
Wondering where to find a tool that surfaces these insights without a PhD in data science? Chatter Plus offers a lightweight overlay that captures session start‑stop events and visualises them in real time – perfect for anyone who wants a quick glance without digging through spreadsheets.
But analytics isn’t just about numbers; it’s also about context. Imagine you’re a freelancer juggling three client projects. Your session analytics might reveal that you switch tasks every 20 minutes, causing a hidden cost of “context‑switch fatigue.” Knowing that, you can batch similar tasks together, reducing the hidden overhead.
And if you’re looking to automate the reporting side of things, RebelGrowth’s roundup of content generators includes tools that can pull session data into a weekly newsletter for your team – no manual copy‑pasting required.
Another angle is visual storytelling. A well‑designed chart can become a conversation starter in a remote stand‑up. Show the team how a 10‑minute micro‑break after a deep‑focus block boosted code commit rates by 12 % – that’s the kind of proof that gets buy‑in.
For those who love a bit of design flair, Maris Graph provides custom visual templates that turn raw session logs into sleek, shareable graphics. It’s a subtle way to keep the data fresh in everyone’s mind.
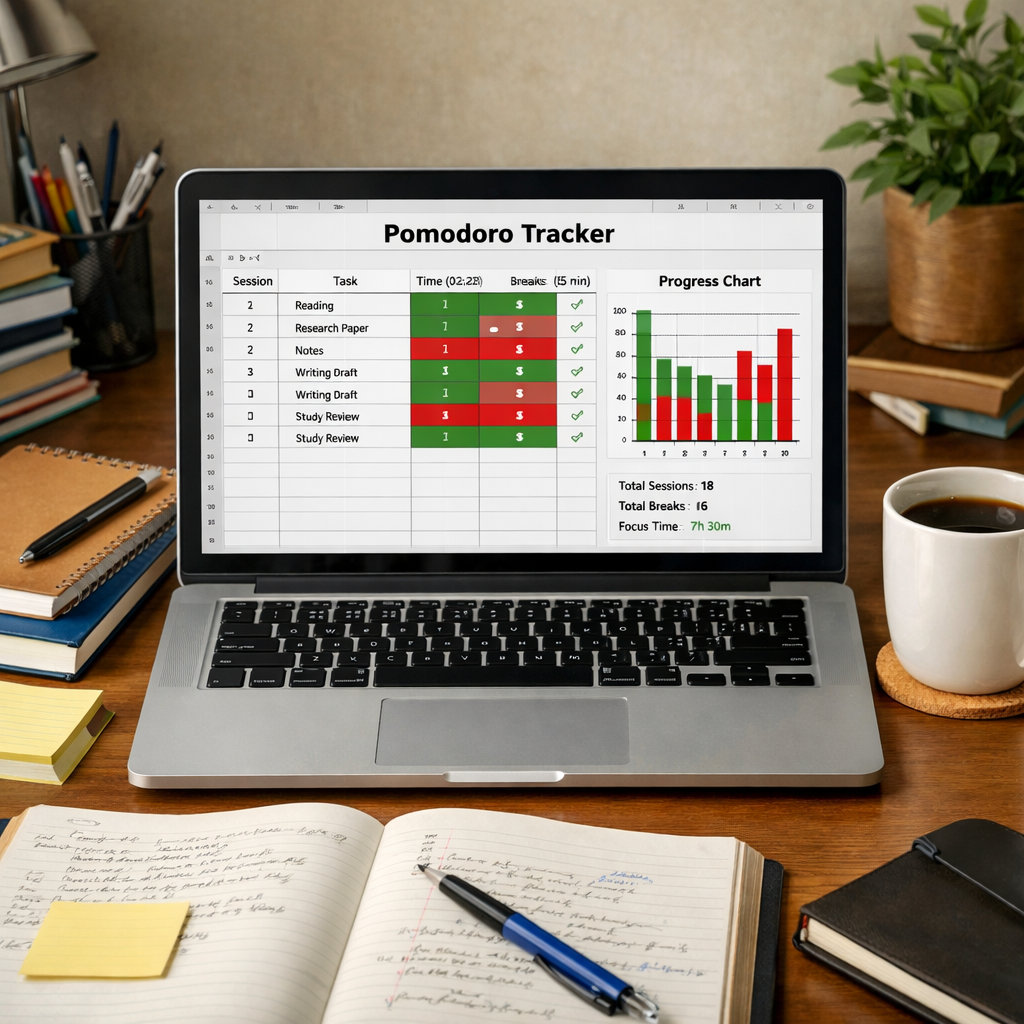
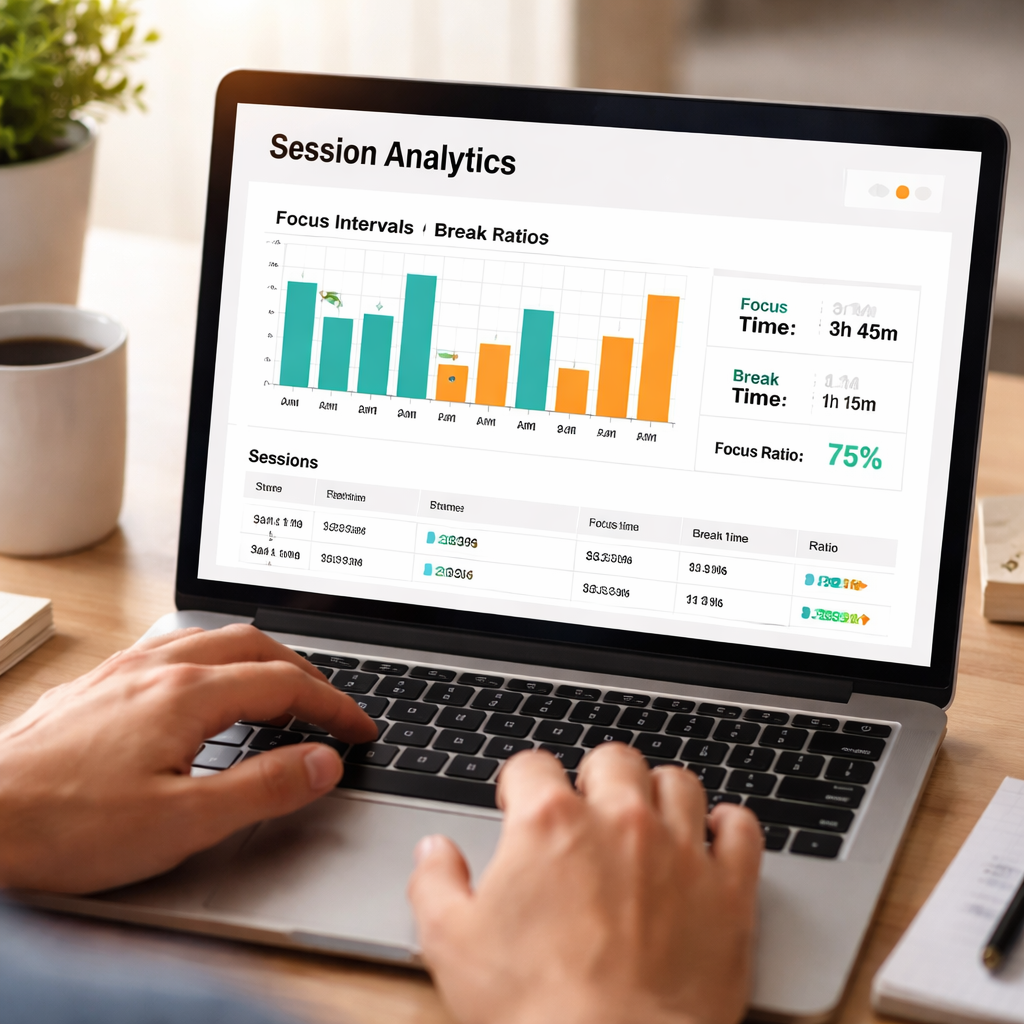
Below is a quick demo of how a typical session analytics view looks in action. Take note of the colour‑coded blocks and the tooltip that tells you exactly how many minutes you spent on each task.
Notice how the graph updates as you finish each Pomodoro – it’s that immediate feedback loop that turns a vague feeling of “being busy” into concrete, actionable insight.
To wrap up, remember that session analytics is less about obsessively tracking every second and more about spotting the moments that matter. When you can see where your focus spikes, where it dips, and how breaks truly affect you, you gain the power to redesign your day on purpose, not on guesswork.
Key Metrics to Track in Session Analytics
Now that you’ve seen the dashboard, you might be wondering which numbers actually matter. A wall of bars looks impressive, but without the right lenses you’ll miss the story the data is trying to tell.
What if you could pick out the three or four signals that instantly reveal whether a Pomodoro cycle is working—or if it’s just a fancy timer?
Session length & focus windows
Average session duration is the heartbeat of your productivity rhythm. For a student, a 25‑minute focus window that consistently shows up as 28 minutes could mean they’re drifting into “soft” focus. For a remote developer, a 50‑minute stretch that stays under the 30‑minute timeout signals deep work.
Tip: compare the median session length to your intended Pomodoro length. If the gap widens over a week, it’s time to tweak the interval.
Break ratio and recovery time
Break length isn’t just a pause; it’s a recovery metric. Track the ratio of break minutes to focus minutes. A 5‑minute break after a 25‑minute focus is a classic 5:1 ratio. If you notice breaks creeping to 12 minutes, your “rest” might be turning into a distraction.
Quick check: look at the “average break time” column. When it spikes, ask yourself whether you’re checking email, scrolling socials, or actually recharging.
Session frequency & consistency
How many sessions do you log each day? A steady count (e.g., 6‑8 Pomodoros) shows a habit that’s anchored. A dip to 3‑4 could mean meetings, fatigue, or a loss of motivation.
Plot sessions per day on a line chart and color‑code days with high focus vs low focus. The visual pattern often reveals external triggers—like a weekly sync that always cuts your flow.
Engagement signals – session key event rate
This metric tells you the percentage of sessions that include a “key” action – for us, that might be clicking the “Start Focus” button, marking a task as complete, or logging a break. A rising key event rate usually means users are actively engaging with the core workflow instead of just watching the timer.
In practice, if your key event rate slides from 80% to 60%, dig into what’s changing in the UI or routine. Maybe a new feature is causing friction.
Drop‑off & bounce within a session
Not every session ends with a clean break. Some users abandon the timer after a minute, which looks like a “bounce” in analytics. Understanding how session duration is calculated helps you see why a single‑page read can register zero minutes.
Set up timer events (e.g., 30‑second, 1‑minute) so the platform records a hit even if the user never switches pages. Those extra timestamps turn invisible drop‑offs into actionable data.
Device & context breakdown
Events per session by device category (desktop, mobile, tablet) reveals where focus is strongest. You might find that students on laptops average 4 events per session, while freelancers on tablets average 2 – a sign that the mobile UI could be streamlined.
Use the device split to prioritize improvements. If a large chunk of your audience is on mobile, a smoother tap‑to‑start experience can lift overall session length.
Quick checklist of must‑track metrics
- Average session duration vs. target Pomodoro length
- Break‑to‑focus ratio
- Sessions per day (habit consistency)
- Session key event rate (core action engagement)
- Drop‑off rate (bounce‑style sessions)
- Events per session by device
Grab this checklist, add it to your weekly review, and you’ll start spotting patterns before they become problems.
So, what’s the next step? Pull the past seven days of data, compare each metric to your ideal values, and jot down one tiny adjustment – maybe a 5‑minute stretch longer break or a reminder to log the “focus start” event. Small tweaks, backed by the right numbers, turn a vague feeling of “busy” into a clear path forward.
Implementing Session Analytics: Tools and Setup
Alright, you’ve already seen which numbers matter. The next question is: how do you actually get those numbers flowing into a dashboard you can trust?
Pick a tool that matches your workflow
If you’re a student juggling lecture slides, a remote dev fighting latency, or a freelancer juggling three client portals, you need a session‑analytics solution that talks to the apps you already use. Platforms like Amplitude’s session replay suite let you capture clicks, scrolls, and timer starts without writing a line of backend code – just drop a tiny JavaScript snippet into your Focus Keeper embed.
Look for three things: real‑time replay, privacy masking (so you don’t accidentally log passwords), and the ability to tag custom events – for us that’s the “focus start”, “break end”, and “task complete” clicks.
Step‑by‑step setup
1. Create a lightweight data layer. In the page that hosts your timer, push an object to window.dataLayer each time a user hits start, pauses, or finishes a Pomodoro. The payload can be as simple as {event:'focus_start', timestamp:Date.now()}. Because it’s just JSON, you can later map it to any analytics provider.
2. Install the tracking snippet. Grab the snippet from your chosen tool and paste it right before the closing </body> tag. Most providers auto‑detect the data layer and will fire an event whenever you push a new object.
3. Define your core events. In the tool’s UI, mark “focus_start”, “break_start”, “break_end”, and “session_end” as key events. This lets you build the “session key event rate” metric we talked about earlier.
4. Set the session timeout. By default many analytics platforms use a 30‑minute inactivity window. If your Pomodoro cycles regularly stretch to 50 minutes, bump the timeout to 60 minutes so a single deep‑work block isn’t split into two sessions.
5. Enable privacy controls. Turn on automatic field masking for any input fields you might have (email sign‑up, notes). This keeps you GDPR‑safe while still giving you the clickstream signals you need.
Validate the data stream
After the snippet is live, open the dashboard’s real‑time view and do a quick test run: start a timer, take a break, finish a session. You should see each custom event appear instantly. If something’s missing, check the browser console for “dataLayer push” errors – they’re usually a typo in the event name.
One trick we love is to add a tiny “debug” flag to the URL (e.g., ?debug=true) that logs every push to the console. That way you can verify the exact payload without digging into network tabs.
Leverage clickstream insights
Beyond the basic events, you can capture the full clickstream – every mouse movement, scroll depth, and page change – to see how users navigate between study notes, task lists, and the timer itself. The Session AI blog explains why clickstream data is becoming the go‑to first‑party source for understanding in‑session behavior (read more about clickstream value).
For a freelancer, a spike in “scroll” events right before a break might hint that they’re trying to skim a long task list before pausing. For a student, repeated “click” events on the “add note” button during a Pomodoro could signal that the note‑taking UI is too clunky and needs a shortcut.
Turn raw data into actionable dashboards
Once events flow in, build a simple dashboard with three tiles:
- Average session duration vs. your target Pomodoro length.
- Break‑to‑focus ratio (percentage of sessions where break time exceeds 20% of focus time).
- Key event completion rate (how many sessions include all four core events).
Set a weekly email reminder to pull the past seven days and jot down one tiny tweak – maybe add a keyboard shortcut for “focus start” or extend the default break by a minute if you notice a dip in focus after the third Pomodoro.
That’s it. With a lightweight data layer, a reputable replay tool, and a habit of weekly reviews, you’ve turned vague feelings of “busy” into a clear, data‑driven routine you can actually improve.
Choosing the Right Session Analytics Platform
When you finally have data flowing from your timer, the next puzzle is: which analytics platform actually helps you turn those numbers into better focus? It’s tempting to just pick the flashiest tool, but the right fit depends on what you need to see, how much you’re willing to spend, and how much privacy you require.
Imagine you’re a remote developer juggling code reviews and stand‑up meetings. You need a solution that captures every click on “Start Pomodoro” and “Pause” without slowing down your browser. Or picture a student cramming for finals who wants a simple replay of study sessions on a laptop that doesn’t store any personal notes.
Core criteria to weigh up
Before we dive into specific tools, ask yourself these questions:
- Do I need real‑time replay of every session, or is a daily summary enough?
- How important is privacy masking for the notes I type during a focus block?
- Can I afford a subscription, or do I need a free tier that still gives me heatmaps?
These criteria map directly onto the three platforms that keep showing up in the industry chatter.
Platform snapshots
| Feature | Platform | What it means for you |
|---|---|---|
| Unlimited session replays + AI‑generated highlights | Microsoft Clarity | Great for freelancers who want a zero‑cost way to see where users drop off, with AI surfacing the most interesting moments. |
| Autocapture with privacy controls & AI summaries | FullStory | Ideal for remote teams that need deep insight into friction points while staying GDPR‑compliant. |
| Self‑hosted, open‑source event collector | Custom lightweight data layer (e.g., using Google Tag Manager) | Best for students or small teams who want full control and zero ongoing cost. |
Notice how the first two rows are fully‑managed services, while the third is a DIY approach. Your choice will hinge on budget, technical comfort, and how much you value “out‑of‑the‑box” AI assistance.
Real‑world examples
We’ve seen a freelance graphic designer switch from a generic heatmap tool to Clarity after noticing that 70 % of his sessions ended within five seconds of opening the “Export” button. The replay revealed a hidden modal that was confusing users. By removing the modal, his average session length jumped from 3 minutes to 12 minutes, and his invoicing workflow became smoother.
A remote software engineer trialled FullStory for a month. The platform flagged a pattern where “break_start” events were followed by rapid “click” spikes on a legacy sidebar. The insight prompted a UI redesign that reduced break‑to‑focus ratio by 15 %, letting the engineer stay in deep work longer.
Actionable steps to pick your platform
- Map your must‑have features. Write down the three things you can’t live without – e.g., replay, privacy masking, free tier.
- Run a 7‑day pilot. Install the free version of Clarity and set up a basic data layer. Compare the replay quality to the screenshots you get from FullStory’s demo.
- Score each platform. Use a simple 1‑5 matrix: Cost, Ease of Setup, Privacy, AI Insights. Total the scores; the highest wins.
- Validate with a teammate. If you work with a peer, have them review a few sessions to confirm the replay actually tells a story, not just raw clicks.
- Lock in a review cadence. Once you’ve chosen, schedule a bi‑weekly check‑in to ensure the tool still meets your evolving workflow.
Those steps keep the decision process grounded in data instead of hype.
Tip from the field
When you’re weighing privacy, remember that most platforms let you mask any field containing personal notes. Turn that feature on from day one – you’ll thank yourself when GDPR audits come around.
Also, don’t overlook the power of a simple internal glossary page. For example, our What is session duration? – Focuskeeper Glossary page helps new users understand the metric they’ll be tracking, which reduces onboarding friction and speeds up insight generation.
Bottom line: the “right” platform isn’t about which one has the flashiest UI, but which one aligns with your budget, privacy needs, and the level of insight you actually act on. Test, score, and iterate – and you’ll turn every Pomodoro into a data‑backed step toward better focus.
Analyzing Session Data to Drive Action
When you finally have a stream of numbers coming from your timer, the real magic starts the moment you ask, “what does this actually tell me about my work day?” That question is the gateway to turning raw session analytics into concrete habits.
What session analytics really captures
At its core, session analytics aggregates every click, scroll and form‑submission that happens inside a single visit, usually bounded by a 30‑minute inactivity window. Instead of looking at isolated events, you get a narrative of what the user (or you) did from start to finish.
Break the data into bite‑size stories
First, slice your sessions by the Pomodoro cycle you’re running – 25 min focus, 5 min break, or whatever rhythm fits your workflow. Tag each slice with a simple label like “focus‑start”, “break‑start”, “break‑end”. When you group them, patterns emerge faster than staring at a flat average.
Does your focus window consistently shrink after the third break? Do you see a spike in “break‑start” events right after a long meeting? Those little clues become the starting points for improvement.
Spot the drop‑offs before they become habits
Next, hunt for sessions that end abruptly – maybe a single‑minute session or a “focus‑start” with no corresponding “break‑end”. Those are the moments when distraction or fatigue won’t let you finish a Pomodoro. Mark them in your dashboard and ask yourself what external factor was present: a notification, a noisy environment, or a task that felt overwhelming.
Align metrics with your personal goals
Every user group has a different success definition. A student might aim for “average focus length ≥ 28 minutes”. A remote developer could target “break‑to‑focus ratio ≤ 0.2”. A freelancer may care about “sessions per day ≥ 6”. Write those targets down, then let the data tell you whether you hit them.
Quick checklist to keep you on track
- Label core events (focus‑start, break‑start, break‑end, session‑end).
- Calculate average focus length vs. your Pomodoro goal.
- Measure break‑to‑focus ratio each day.
- Flag sessions under 2 minutes as potential drop‑offs.
- Review the flagged list every Friday and note one tweak.
That tiny habit of a weekly review is what SmartMetrics describes as turning session data into actionable insights. It doesn’t require a data scientist – just a few minutes of curiosity.
Real‑world scenarios
Imagine Maya, a college sophomore, who sees that every time she studies biology after lunch her focus windows dip to 18 minutes. She experiments by swapping the subject to the morning slot, and her average focus jumps back up. The insight came from a simple session split.
Or think about Alex, a remote software engineer, who notices that on days with back‑to‑back video calls his “break‑start” events cluster around the 30‑minute mark. He adds a 10‑minute buffer between calls, and his deep‑work sessions extend by 12 minutes on average.
Freelancers often juggle multiple client portals. One designer tracked that sessions longer than 45 minutes always included a “switch‑project” click right before the break. By consolidating related files into a single board, she shaved five minutes off each break and reclaimed nearly an hour per week.
From insight to action – a three‑step routine
- Pull the last seven days. Export the session‑duration and event counts into a spreadsheet or your dashboard.
- Spot the outliers. Highlight any day where average focus < target or break ratio > 0.25.
- Apply one micro‑adjustment. Maybe a longer warm‑up, a muted notification, or a shortcut key for “focus‑start”. Record the change and re‑measure next week.
It feels a little like detective work, but the payoff is real – you stop guessing and start iterating with evidence.
Give yourself permission to treat each session as a story, not a data dump. By regularly dissecting the numbers, you’ll keep your Pomodoro rhythm aligned with how your brain actually works, and that alignment is the secret sauce behind sustainable focus.
Conclusion
We’ve walked through how session analytics turns vague feelings of “busy” into clear, actionable numbers.
Does it feel like a lot of data to digest? Think of each session as a short story you already live—your timer, a break, and a click. The analytics simply writes that story down so you can spot the plot twists.
For students, that might mean noticing a dip in focus after lunch and swapping subjects. Remote workers can catch the moment a back‑to‑back meeting forces a premature break and insert a buffer. Freelancers often see that a “switch‑project” click signals hidden friction, prompting a smarter file layout.
What matters most is the habit of a weekly review: pull the last seven days, flag outliers, and try one micro‑adjustment. The payoff is real—more focus minutes, fewer wasted breaks, and a rhythm that matches how your brain naturally works.
So, what’s the next step? Open your session‑analytics dashboard tomorrow, mark the first session that feels off, and set a tiny experiment. When you see the numbers shift, you’ll know the insight wasn’t just theory—it was your own data guiding you.
Remember, session analytics is a tool, not a magic bullet. Keep it simple, stay consistent, and let the evidence steer your Pomodoro practice toward sustainable productivity.
FAQ
What exactly is session analytics and how does it differ from regular time tracking?
Session analytics looks at the whole sequence of actions you take during a work interval – from clicking “start focus” to opening a new tab, taking a break, and ending the timer. Traditional time tracking usually just records the total minutes you were “on the clock.” By capturing the steps in between, session analytics tells you where focus spikes, where distractions creep in, and which habits are actually moving the needle.
How can I use session analytics to improve my Pomodoro routine?
Start by pulling the last week’s data and spotting any sessions that end early or have unusually long breaks. If you see a pattern – for example, a 10‑minute break after every third Pomodoro – try shortening that pause or adding a quick stretch. Then run the same report a week later and compare the average focus length. Small tweaks based on real numbers usually lift your productivity more than guessing.
Do I need a fancy analytics platform to get useful session data?
No, you don’t have to invest in an enterprise‑grade tool. Most modern timer apps, including Focus Keeper, can export basic session events as CSV files. With a spreadsheet you can calculate average session length, break‑to‑focus ratios, and even flag sessions under two minutes. If you want visual replay, a free service like Microsoft Clarity can show you click patterns without charging a dime.
What’s the best way to interpret a high “drop‑off” rate in my sessions?
A high drop‑off rate means a lot of sessions end abruptly – often after just a minute or two. First, check whether a notification, a noisy environment, or a confusing UI element coincides with those moments. Try muting alerts, moving to a quieter spot, or simplifying the task list. After you make a change, re‑run the report; you should see fewer short sessions and a steadier flow of focus blocks.
Can session analytics help me balance work across multiple projects?
Absolutely. Tag each Pomodoro with the project you’re tackling, then group the data by tag. You’ll see which projects consume the most focused minutes and which get interrupted most often. If a client’s work consistently triggers short, fragmented sessions, consider batching those tasks into a longer block or scheduling them after a low‑distraction period. The insight lets you allocate time where it actually matters.
How often should I review my session analytics to see real benefits?
We recommend a quick weekly review – pull the past seven days, glance at average focus length, break ratios, and any outliers. Spend about ten minutes noting one tweak you’ll try the following week, whether it’s a longer warm‑up, a different break activity, or a new notification setting. Then repeat the process. Consistent, small adjustments compound over time and turn the raw numbers into a habit‑forming feedback loop.